Abstract
This paper combines the methodologies of green-house-gases (GHG) emission inventories, emission factors by the Inter-governmental Panel on Climate Change (IPCC) and specific emission factors for Vietnam to assess GHG emission, reduction potentials and costs in Quang Ninh province. GHG emissions from sectors of energy, transportation, agriculture, forest and land use (AFOLU) in Quang Ninh have a tendency to increase fast up to approximately 29.25 – 31.55 million tons of CO2 equivalent (CO2e) in 2020 and around 32.90 – 35.13 million tons of CO2e in 2030. With 16 opportunities in industries and energy, 7 opportunities in AFOLU, the potentials of GHG reduction towards 2020 respectively are 3.03 and 2.22 million tons of CO2e; for 2030 respectively 4.34 and 2.38 million tons of CO2e, with the total costs respectively at 1,671 billion VND and 578 billion VND (exchange rate at VND 23,000 = USD 1). Quang Ninh province needs to complete and announce the provincial green growth action plan (PGGAP) with the list and information of GHG reduction opportunities to create consensus as well as attract investments from private sector and the community; review financial policy framework and other related policies to promote the GGAP implementation.
Keywords: Green House Gas (GHG); Emission Reduction; Green Growth Action Plan (GGAP); Quang Ninh province.
1. Introduction
Green growth (GG) is increasingly recognized and accepted as a suitably fundamental model for sustainable development (SD) in the context of climate change (CC) by more and more countries worldwide. Vietnam is among some of pioneer developing countries that have issued National GG strategy (Decision No. 1393/QĐ-TTg dated 25/9/2013) and the National GG Action Plan (GGAP for the period 2013-2020 (Decision No. 403/QĐ-TTg dated 20/3/2014), with the objectives: to reduce the greenhouse gases (GHG) emission intensity around 8 - 10% for the period 2011 – 2020 in comparison to that of 2010; the direction towards 2030 - 2050 is to reduce GHG at least 1.5 - 2% annually. The National GGAP requests each province/ city to study and develop the GGAP and suitable GHG reduction plans.
Quang Ninh province - one of the economic drivers in the Key Northern Economic Zone and the whole country, has identified its priority in enhancing the capacity to respond to CC, reducing emission while increasing sequestration potentials of GHG. Quang Ninh People’s Committee issued the provincial Action Plan no. 6970/KH-UBND dated on 16 November 2015 to implement the National GG strategy for the period 2016-2020. The province aims to sustainable socio-economic development in line with National GG strategy’s targets, including prioritized ones: Economic structure is gradually shifting from “brown” to “green” activities, prioritizing non-mining industries and services, in parallel with more sustainable and cleaner coal mining; Intensifying investment for socio-economic infrastructure and applying science and technology; Environment protection and active responses to climate change. However, this action plan does not yet introduce the list of GHG reduction projects based on specific calculation on their reduction potentials and costs. Therefore, it is essential to study to assess these potentials and costs for GHG reduction, leading to the contribution for scientific foundation, proposing suitable mechanisms and policies to serve the formulation of Quang Ninh GGAP towards 2020 and 2030, making important part of the national efforts in realizing the National GG Strategy and Action plan for SD in Vietnam.
2. Research Methodology
Procedure for assessing GHG reductions
The procedure for assessing GHG reduction includes 6 main steps as shown in Figure 1.
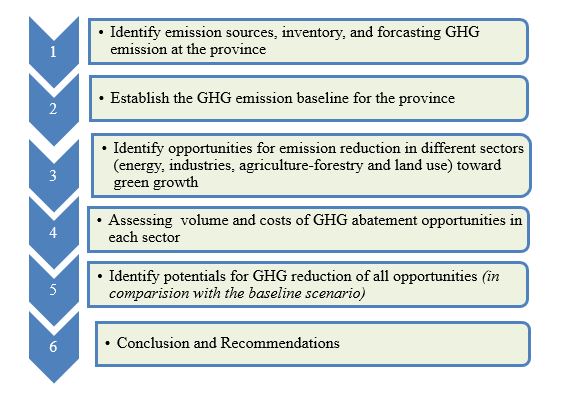
Figure 1. Procedure for assessing GHG reduction in Quang Ninh province
Source: authors’ proposal
Methodology for calculating GHG emission
Calculation of emission for GHG inventories and projection is conducted under GHG inventory methodology issued by IPCC for the 1st time in 1995, revisions in 1996, complimentaries in 2003 and 2006.
According to IPCC’s methodology and related documents, GHG emission/ absorbance volume of an activity is calculated by the following formula:
Where:
Ei: GHG emission/ reduction or absorbance volume of activity i (unit in ton of CO2e)
ADi: level of activity in sector/ sub-sector i (for example: number of transportation vehicles, rice cultivation areas, the number of husbandries, used fuel volume …)
EFi: GHG emission factor estimated for each unit of activity (for example, kg of carbon emitted on each unit of cultivation area or fuel volume burnt,…).
CO2e: factor for converting emissions in to CO2 equivalent.
Factors of EFi used in this study are specific factors (Tier 2 and 3) for Vietnam. In cases there are no respective data, public announcement or accepted by Vietnam, default factors Tier 1 by IPCC 2006 are used.
Three types of GHG that are assessed include CO2, CH4, and N2O; all converted into volume of CO2 equivalent (CO2e) via global warming potential index (GWP) provided in the second report of IPCC in 1996 (SAR) and the fifth report in 2014 (AR5) (See Table 1).
Table 1: Weighs for converting GHG into CO2 equivalent according
to GWP index
|
Type of gas
|
Symbolic
|
Global Warming Potentials (GWP)
|
|
SAR
|
AR5
|
|
Carbon dioxide
|
CO2
|
1
|
1
|
|
Methane
|
CH4
|
21
|
28
|
|
Nitrous oxide
|
N2O
|
310
|
265
|
Sources: IPCC (1996, 2009,2016)
Four sectors to be studied include (i) emission from energy in “non-transportation” activities (immobile energy); (ii) emission from transportation; (iii) emission from industrial processes; and (iv) emission from agriculture-forestry-other land uses.
Identify opportunities for GHG reduction
Two steps were conducted in identifying GHG emission reduction opportunities. Step 1 involved approach of brain storming, discussing with experts from Energy Institute, Ministry of Industry and Trade; Agriculture Environment Institute; Institute of Strategy and Policy for Agriculture and Rural Development; Ministry of Construction… A “long list” of 51 emission abatement opportunities were defined, which included: 24 opportunities in energy sector (transportation, tourism, buildings, hotels, restaurant, households, industry, aquaculture,…); 16 in agriculture, forestry and land use (infrastructure, environment, high-tech, …); 5 in industry sector (activities in cement sector, construction materials and freezing system); 6 in institutional area. Step 2 is opportunities screening, which employed consultation with provincial departments and agencies in Quang Ninh (Departments of Planning and Investment; Industry and Trade; Agriculture and Rural Development; Natural Resources and Environment; Tourism; Transportation; Construction...), making analysis in all aspects of economic, social and environment, institution; strength, weaknesses, opportunities, threats (SWOT) for groups of opportunities and each opportunity; using questionnaire for selecting opportunities. After all, a “short list” of 35 opportunities are considered as practical and get more than >50% of votes from local experts.
Assessing GHG abatement opportunities and relevant costs
Five steps to assess GHG abatement costs are simplified in the expert approach: (1) Consult with experts to identify abatement technologies/ opportunities in areas of energy, transportation, agriculture, forestry and land use; (2) Refer market prices and experts on investment and operation costs, project life cycles… of the abatement opportunities; (3) Develop Excel-based calculation sheet for calculation of cost-benefit of those selected opportunities; (4) Import calculated data to MACC Builder Pro – a software that allows to present marginal abatement costs of mitigation opportunities in the ranking order, from the lowest to highest cost; (5) Adjust prioritization of opportunities based on the outputs from MACC Builder Pro.
Data sources
Sources of data used in calculating GHG emission and mitigation in Quang Ninh include:
- Data on economic and emission sectors from Annual statistics, Provincial Statistics Agency; Provincial Department of Industry and Trade, Department of Planning and Investment, Department of Construction; Department of Transportation; Transportation Safety Committee; Department of Agriculture and Rural Development; National Electricity Master Plan; Electricity Corporation; Provincial socio-economic development master plans; Expert consultations.
- Data on emission factor and other parameters from Spreading factor of GHG in coal mining in Vietnam; Electricity transmission emission factor in Vietnam; Cement Emission Factor in Vietnam; Ratio of coal pit and open mining; Emission Factors in rice cultivation and husbandry waste management in Vietnam; GHG sequestration factor in forestry; Emission factors by IPCC revised in 1996, 2006; Conversion factors SAR, AR5; Ex-Act Tool (FAO, 2016).
Time frame: Time frame for GHG emission inventory (historical data) is 2010 – 2015; GHG emission and reduction projection serves for establishing Quang Ninh’s GGAP towards 2020 and 2030.
3. Results
GHG emission sources in Quang Ninh province
Quang Ninh has the area of over 12,200 square km. The province holds diversified natural resources with specific species and large storage with high quality, including: coal, kaolin, clay, glass sand and lime stones,…, top tourism potentials with famous beaches and Ha Long Bay and Bai Tu Long Bay Landscape…
Being the number 1 coal mining and supplying center of Vietnam with annual volumes from 35 to 40 million tons, this is one of the main emission sources of CH4 at present and in the future. In addition, with nearly 2,000 MW thermal capacity, GHG emission from power generation in Quang Ninh is quite high. Road and water transportations play important role in the province’s economic development and as one of the major GHG emission sources. In industry, with nearly 100 high energy consuming enterprises (covering 6% of the country’s in 2015), there are various groups and large companies located in the province, energy consuming activities in industrial production has continued to one of the key GHG emission sources in Quang Ninh. Furthermore, buildings (offices and living quarters) and households are also remarkable emission sources.
Thus, main sub-sectors selected to be studied are those having visible impact on the provincial economic restructuring process, with remarkable emission levels, or emission absorbance, including: coal exploitation; power generation; energy for industrial production; energy in buildings and households; energy in transportation; industrial processes – cement production; husbandries; rice cultivation and forestry.
GHG emission calculation and projection
The results of GHG emission calculation and projection based on 2 conversion factor versions of SAR and AR5 are presented in Table 2.
Table 2: GHG emission in year 2015, projection towards 2020 and 2030
Unit: thousand tCO2e
|
Sectors
|
Emission factor in SAR
|
Emission factor in AR5
|
|
Year 2015
|
Year 2020
|
Year 2030
|
Year 2015
|
Year
2020
|
Year 2030
|
|
Energy
|
20,103.97
|
28,935.27
|
29,484.78
|
21,618.98
|
30,947.56
|
31,064.46
|
|
Agriculture
|
1,421.20
|
1,808.95
|
2,362.74
|
1,776.38
|
2,287.10
|
3,010.22
|
|
Forestry*
|
-3,529.21
|
-3,731.03
|
-3,731.03
|
-3,529.21
|
-3,731.03
|
-3,731.03
|
|
Industry
|
2,874.24
|
4,787.76
|
4,787.76
|
2,874.24
|
4,787.76
|
4,787.76
|
|
Total (master plan)
|
20,870.19
|
31,800.95
|
|
22,740.39
|
34,291.40
|
|
|
Total (revised master plan)
|
20,870.19
|
26,245.86
|
32,904.25
|
22,740.39
|
28,349.77
|
35,131.40
|
* Forestry sector absorbed GHG, then the net emission is less than 0 (<0)
Sources: author’s calculation
The GHG projection towards 2020 and 2030 are based on socio-economic development targets set by the province (Quang Ninh’s socio-economic development master plan towards 2020, vision to 2030 – Decision No. 2622/QĐ-TTg, 2013; The revised master plan in 2015), and expert consultations on tendency of households’ consumption as well as technology trend in some sectors.
The calculation results show that energy is the largest emission sector in the province, accounting more than 80% of the total emission over years. However, the total emission volume of coal sector holds decreasing trend due to green economic direction, volumes of coal mining and consumption have reduced. Energy production and consumption from other sectors, as well as cement production industry tends to rise in recent years. Emission from agriculture-forestry sector remains negative (sequestration).
Using AR5’s emission factors leads to a higher emission from 7 to 10% in comparision with using those of SAR.
Identification and assessment of potentials and costs of GHG emission reduction opportunities
Based on reference to market prices, in discussion with experts and related departments in Quang Ninh on parameters and essential assumptions during the calculation of investment capital, annual costs/ benefits, project cycle, emission intensity, amount of CO2e emission reduced, … for each opportunity in the short list. Costs/ benefits and investment parameters for each opportunity will be imported to Excel calculated sheet established by the author. The calculated results then continues to be imported to MACC Builder Pro software. There are just 23 opportunities with potential to come to final results by meeting the requirements of the Excel sheet and of MACC Builder Pro, include 16 opportunities in industry and energy sector and the other 7 in agriculture and forestry sector.
The total potential for emission reduction in industry and energy sectors in Quảng Ninh towards 2020 is 3.03 million tCO2e as shown in Table 3.
Table 3. Potential for emission reduction in industry and energy sectors
by the year 2020
|
|
Opportunity
|
Costs of Implementation (mil VNĐ)
|
Amount of emission reduction (tCO2e)
|
Project cycle
(year)
|
|
1
|
Assist in using biofuel E5, B5 in public transportation replacing 100% of traditional petroleum
|
50,000
|
30,480
|
35
|
|
2
|
Assist in using biofuel E5, B5 in goods transportation, replacing 100% diesel
|
80,000
|
48,150
|
35
|
|
3
|
Assist in solar hot water tank (joining EVN efforts)
|
1,107,671
|
366,940
|
15
|
|
4
|
Develop public transportation system (bus replacing 9% of individual vehicles, electricity vehicles replacing 35% individual vehicles)
|
1,399,440
|
308,100
|
35
|
|
5
|
Assist high energy efficiency air conditioner for households (60% households in urban area, 20% in rural area).
|
348,153
|
267,580
|
7
|
|
6
|
Assist in using high efficient LED in lighting system in 90% of households
|
19,171
|
13,440
|
5
|
|
7
|
Assist in equipping high efficient refrigerators in 100% of households
|
50,055
|
24,480
|
7
|
|
8
|
Support to replace lighting systems with high efficient lights in buildings – hotels – trade and services (100% buildings in the province)
|
25,515
|
16,770
|
15
|
|
9
|
Equip solar heating water in hotels and buildings (65% of hotels/buildings in the province)
|
22,235
|
8,930
|
20
|
|
10
|
Establish energy control system in industrial enterprises (75% of enterprises located in the province)
|
15,000
|
15,040
|
25
|
|
11
|
Tourist Information centers and street lighting system using solar energy (10,000 centers and spots in the province)
|
42,000
|
14,700
|
20
|
|
12
|
Using high efficient amorphous for the electricity transmission network (100% amorphous stations to be newly invested and regularly maintained and upgraded)
|
700,000
|
151,250
|
15
|
|
13
|
Installing small/household scale solar system in remote mountainous areas and islands (15% of households)
|
4,725,124
|
1,160,820
|
20
|
|
14
|
Assist in installing waste heating recovering system for power generation in 4 cement plants in the province (total capacity is 16 MW)
|
201,600
|
98,940
|
30
|
|
15
|
Assist in installing high efficient air conditioner in hotels, high buildings (75% office/commerce buildings and hotels in the province)
|
255,150
|
268,330
|
7
|
|
16
|
Remove and replace 100% handmade brick kilns by advanced technology ones
|
907.87
|
238,840
|
8
|
Source: Calculation results from Excel sheet and MACC Builder Pro software
The total investment capital need for 16 opportunities (in present value) is around 9 thousand billion VND.
In the Agriculture-Forestry-Land use, GHG emission reduction potential for 2020 of 7 opportunities is 2,22 million tCO2e., as shown in Table 4.
Table 4. GHG emission reduction potential in Agriculture-Forestry-Land use sector by the year 2020
|
|
Opportunity
|
Volume of GHG emission reduced (tCO2e)
|
|
1
|
Optimal use of and replace nitrogen fertilizer in all rice cultivation areas of the province
|
20,860
|
|
2
|
Using bio char to improve efficiency of rice plantation in all cultivation areas of the province
|
3,350
|
|
3
|
Water saving and control in rice cultivation using 3D3I (3 decrease and 3 Increase in all rice cultivation areas of the province
|
23,280
|
|
4
|
Convert unused land into special-used forest land
|
16.210
|
|
5
|
Convert unused land into protection forest land
|
529.990
|
|
6
|
Convert unused land into production forest land
|
690.810
|
|
7
|
Support to install biogas system for household and farm scale husbandry (50% of key cattle heads: pigs, cows)
|
933.250
|
Source: Illustration from calculation results by Excel sheet and MACC Builder Pro
Continue to project to year 2030 on 16 opportunities in industry and energy sectors, GHG emission reduction potential is of 4.34 million tCO2e, total cost at present value is 1,671 billion VND; 7 opportunities in Agriculture – Forestry and Land use with the GHG emission reduction potential of 2,384 million tCO2e, total cost at present value is 578 billion VND.
Analysis on GHG emission reduction’s impacts in different scenarios
In comparison to business as usual (BAU) scenario, the total potential of GHG emission reduction for all opportunities in green growth scenario is 5.25 million tons of CO2e in 2020 and 6.72 million tons of CO2e in 2030, achieving 20 - 25 % of the province’s emission intensity in 2010; 23 – 28% of the province’s emission intensity in 2015. The emission reduction in 2030 also reach approximately 21% of the province’s emission intensity in 2020.
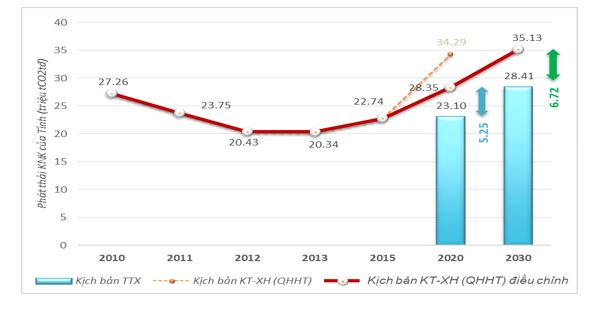
Figure 2. Projected emission for baseline and green growth scenarios
Source: Calculation and synthesis by authors
Additionally, if following the green growth scenario, the province’s emission intensity in GDP will be down from 0.60 – 0.65 tons of CO2e/ 1 million VND to 0.15 – 0.16 tons of CO2e/1 million VND.
Table 5. GHG Emission Reduction and Emission Intensity in GDP
in various scenarios
|
Item
|
Unit
|
Volume
|
|
SAR
|
AR5
|
|
Emission in 2010
|
million tCO2
|
25.13
|
27.26
|
|
Emission in 2020 (baseline scenario)
|
million tCO2
|
32.28
|
34.29
|
|
Emission in 2020 (master plan revised scenario)
|
million tCO2
|
26.25
|
28.35
|
|
Emission in 2020 (green growth scenario)
|
million tCO2
|
21.53
|
23.10
|
|
Emission in 2030 (projection)
|
million tCO2
|
32.90
|
35.13
|
|
Emission in 2030 (green growth scenario)
|
million tCO2
|
26.85
|
29.88
|
|
Emission reduction potential towards 2020
|
million tCO2
|
4.72
|
5.25
|
|
Emission reduction in 2020 in comparison with 2010
|
%
|
22.2
|
19.23
|
|
Emission reduction potential towards 2030
|
million tCO2
|
6.05
|
6.72
|
|
Emission reduction in 2030 in comparison with 2010
|
%
|
24.07
|
24.62
|
|
Emission reduction in 2030 in comparison with 2020
|
%
|
23.04
|
23.72
|
|
Emission intensity in GDP (comparative price in 1994)
|
|
2010
|
tCO2/ million VND
|
0.60
|
0.65
|
|
2020 (baseline scenario)
|
tCO2/ million VND
|
0.25
|
0.26
|
|
2020 (master plan revised scenario)
|
tCO2/ million VND
|
0.19
|
0.22
|
|
2020 (green growth scenario)
|
tCO2/ million VND
|
0.16
|
0.18
|
|
2030 (master plan revised scenario)
|
tCO2/ million VND
|
0.18
|
0.19
|
|
2030 (green growth scenario)
|
tCO2/ million VND
|
0,15
|
0,16
|
|
Emission intensity reduction in 2020 in comparison to that of 2010 (green growth scenario)
|
%
|
15.8
|
18.1
|
|
Emission intensity reduction in 2030 in comparison to that of 2010 (green growth scenario)
|
%
|
16.7
|
19.1
|
|
|
|
|
|
|
Source: calculation by the authors
4. Conclusion and Recommendations
Conclusion
- -Implementing GHG emission reduction opportunities in green growth action plan scenario is essential to achieve targets set in Vietnam’s Green Growth Strategy (VGGS);
- GHG emission reduction opportunities in Quang Ninh province are mainly in 2 key sectors of energy & industry (16 opportunities) and agriculture – forestry – land use (7 opportunities);
- Order ranking of priorities is based on factors having impacts on the cost effectiveness like time, project cycle, investment need and operation, abatement costs, emission reduction scale and potential, other technology, social and institutional... requirements. Among the 2 sectors, opportunities in the agriculture - forestry sector should be quickly realized.
- It is important to design plan and roadmaps for implementing opportunities, starting from simple ones with small investment need; at the same time, it is essential to establish institutions and strategy to promote mobilization from enterprises, local and foreign investors for big and long-term opportunities.
Recommendations
- Based on the recognition of cost-effectiveness and potentials of GHG emission reduction opportunities in Quang Ninh, it is important to promote the implementation of those opportunities;
- There needs a suitable mechanism to attract, involve and support all individuals, institutions and sectors in and outside the province to develop and realize National Green Growth Strategy at the local level in Quang Ninh;
- It requires continuation of studying, identifying, updating and assessing new GHG emission reduction opportunities;
- Other activities include:
- Complete and publish the province’s GGAP attached with the list of GHG emission reduction opportunities in full information to create the consensus and to attract investment from enterprises and communities;
- Review all provincial regulations and strategies to propose either revision or issue new implementation framework in accordance with green growth direction;
- Study to complete management organization structure to strengthen cooperation and coordination among agencies, institutions in realizing GG and sustainable development;
- Complete the program for establishing mechanism and policy to mobilize and managing resources (finance, humans) for GG towards 2020 and 2030;
- Develop criteria to identify GG programs/ projects;
- Formulate monitoring, evaluation and reporting framework/ plans on the implementation of Green Growth Strategy (GGS) and Action Plan;
- Develop provincial policy framework for budget allocation and management to promote GGS implementation;
- Establish financial policy framework (inlcuding: tax, fees, subsidies, facilities, sanctions, green/ sustainable criteria for enterprises posted on sttock markets) to promote GGS implementation.
Assoc. Prof. Dr Le Thu Hoa
hoalethu@neu.edu.vn
Faculty of Environmental, Climate Change and Urban Studies,
National Economics University, Hanoi, Vietnam
PhD Student Nguyen Thi Dieu Trinh
trinh4mpi@gmail.com
Department of Science, Education, Natural Resources & Environment,
Ministry of Planning & Investment, Hanoi, Vietnam
(International Conference ICSEED2019)
References
1. Food and Agriculture Organization of the United Nations (FAO, 2016a), Ex-Act User Manual.
2. GHG Protocols. (2014), Global Protocol for Community-Scale Greenhouse Gas Emission Inventories. Retrieved from GHG Protocols: http://www.ghgprotocol.org/city-accounting
3. Le Thu Hoa et al (2017), Research on Application of Carbon Balance Apsaisal in Agriculture and Land Use Change, Resarch project, National Economics University.
4. IPCC (1995), Second Assessment Report: Climate Change 1995 (SAR). Intergovernment Panel on Climate Change.
5. IPCC (1997), Revised 1996 IPCC Guideline for National Green House Gas Intervention, IPCC Panel.
6. IPCC (2006), Guidelines for National Greenhouse Gas Inventories Volume 1, 2, 3,4, Institute for Global Environmental Strategies, Japan, ISBN 4-88788-032-4.
7. IPCC (2014), Climate Change 2014: Synthesis Report, Contribution of Working Groups I, II and III to the Fifth Assessment Report of the Intergovernmental Panel on Climate Change, Geneva, Switzerland, 151pp
8. Nguyen Thi Dieu Trinh, Le Thu Hoa, Ha Dang Son (2017), A Systematic Approach To Quantify Green House Gas Targets In Provincial Green Growth Action Plans: An Illustration With Energy Portfolio, 8th International Conference on Socio-Economic and Environmental Issues in Development, 12-13 May 2017, Hanoi.
9. Nguyen Thi Dieu Trinh (2018), Aligning Near- and Long-Term Planning in Vietnam to Meet the Goals of the Paris Agreement, Research of Wolrd Resource Institute for the 2050 Pathways Platform and the NDC Partnership, March 2018.
10. UNEP (2011), Toward a Green Economy: Pathway to Sustainable Development and Poverty Eradication - A Synthesis for Policy Maker.
11. World Bank (2012), The Low Carbon City Development Program (LCCDP) Guidebook, A systems Approach to Low Carbon Development in Cities; The World Bank, DNV KEMA Energy and Sustainability.
12. Wuppertal Institute for Climate (2006), Environment and Energy: Options and Potentials for Energy End - Use Efficiency and Energy Services, Wuppertal, Germany.